Problem Statement: Build a Machine Learning solution for enforcing ad policy against drugs sale ads.
Clarifying Questions
- How do we define drugs?
- This is a very important question. We could have a list of terms which relate to known drugs.
- How do we define sale of drugs?
- It’s necessary to understand that we are interested in ads selling drugs, so it crucial to know what sale means in this context.
- How do we define violation by an ad?
- Ads with drugs but not selling them is okay. To violate the policy, the ad must represent sale of a drug (banned by the policy).
- How do we enforce the policy?
- This could range from blocking the ad, flagging/penalising the ad account and taking actions, blocking URLs in the ad.
- Is there an existing system in place?
- If there is an existing system in place, then we have a baseline to compare our new ML system.
Business Objectives
There could be a number of possible business objectives, and depending on the organisation and business requirements, we could prioritise one over the other.
- Legal compliance: Various rules and regulations are applicable to the advertising industry. By implementing a system that actively enforces ad policies related to drugs, we could mitigate legal risks and potential liabilities associated with facilitating illegal or unauthorised activities.
- User safety and trust: By preventing drug sale ads from appearing on the platform, the objective is to protect users from potentially harmful or illegal activities associated with drugs.
- Brand reputation: Safeguard the reputation of the advertising platform and associated brands by proactively preventing drug sales-related advertisements. By maintaining a strong stance against such ads, the objective is to foster a positive brand image and attract reputable advertisers.
- User experience: Enhance the overall user experience by promoting ads that are relevant, safe, and aligned with users’ interests and values. By effectively filtering out drug sale ads, the objective is to provide users with a positive and engaging advertising experience.
- Revenue generation: The enforcement of ad policies against drug sale ads may indirectly support revenue generation. By maintaining a clean and trustworthy advertising environment, the platform can attract more advertisers and encourage increased user engagement and conversions.
Requirements
- Training
- We would need to update the model with new data, though this need not happen very often.
- Inference
- We could have a system in place, which runs this model when new ads get submitted to the system for verification, before they get displayed. This would mean that the inference time would not directly impact a user.
Give an overview of the various components to discuss at this point: Training data, Feature Engineering, Modelling, Evaluation, Deployment and monitoring. Then proceed talking about each component. This shows organisation and structure to your approach, more typical of senior candidates.
Training Data
- How to collect training data?
- Training data would consist of all the historical ads (including drugs related ads) present in the system.
- Labelling
- We could use user interactions corresponding to ads. If someone reports an ad as inappropriate, we could ask if it’s related to drug sales.
- We could use human annotators to label the ads, by providing clear instructions to them. This would be more expensive, time taking and could be prone to errors. To make labelling more accurate, we could ask multiple people to label the same ad and take majority vote to label the ad.
- Class Imbalance
- There would be very few advertisements related to sale of drugs.
- If class imbalance is deemed a problem after analysing the data, we could use resampling (oversampling the minority class or undersampling the majority class), but this could have its own issues like risk of losing important data after undersampling and risk of overfitting after oversampling.
- We could also use algorithmic methods to deal with this (For details, read “Training Data” under ML Design Basics”).
- Ensembles seem to work well when there is class imbalance.
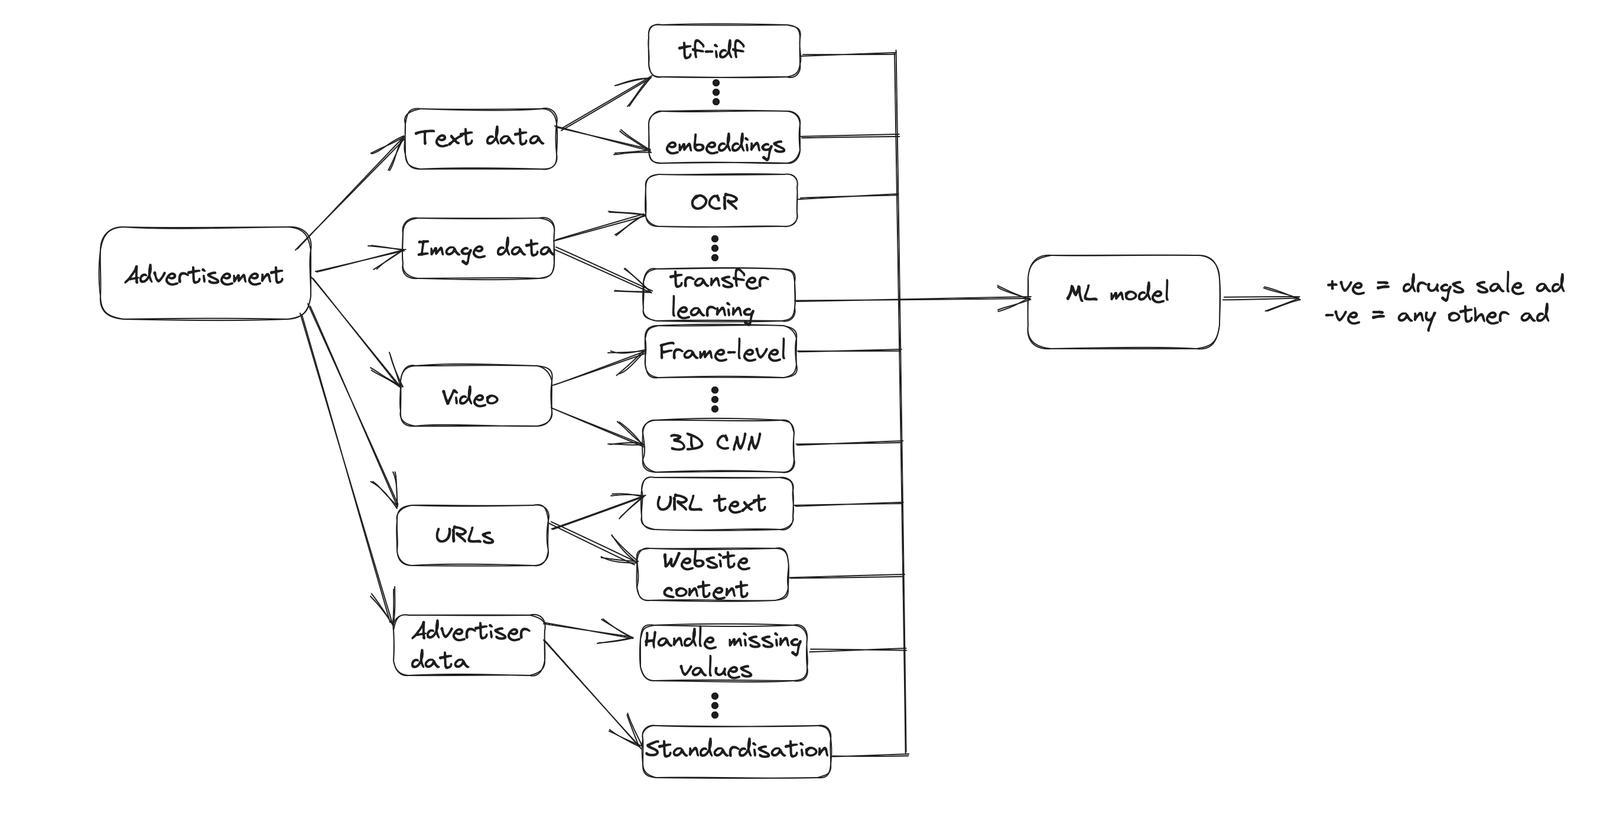
Feature Engineering
- Text: Most advertisements would consist of some text data. It can be featurised using a variety of techniques:
- Bag of Words (BoW): This technique represents text data by creating a vocabulary of unique words present in the corpus. Each document or ad is then represented as a vector, where each element corresponds to the frequency or presence of a word in the vocabulary. The BoW representation ignores the word order and only considers the occurrence or frequency of words.
- TF-IDF (Term Frequency-Inverse Document Frequency): TF-IDF calculates the importance of a word in a document relative to the entire corpus. It assigns higher weights to words that appear frequently in a specific document but infrequently across other documents. TF-IDF combines term frequency (TF) and inverse document frequency (IDF) to create a numerical representation of text data.
- N-grams: N-grams capture the sequential relationship between words by considering contiguous sequences of N words. For example, unigrams (N=1) consider individual words, bigrams (N=2) consider pairs of words, and trigrams (N=3) consider triplets of words. N-grams can be used to capture local contextual information in text data. This can be used with Bag of Words or TF-IDF to featurise text.
- Word Embeddings: Word embeddings capture the semantic meaning of words by representing them as dense vectors in a continuous vector space. Popular word embedding models like Word2Vec, GloVe, or FastText learn representations that preserve semantic relationships between words. These embeddings can be used to convert words in the text data into numerical vectors.
- Images: Ads have images as well either representing what they are trying to sell or containing text in image form.
- OCR (Optical Character Recognition): We could use OCR tools like Tesseract or GOCR to extract text from the image. This could then be featurised like any other text.
- Pre-trained Convolutional Neural Networks (CNNs): CNNs are powerful deep learning models commonly used for image recognition tasks. Pre-trained CNN models, such as VGG16, ResNet, or Inception, are trained on large image datasets like ImageNet. By utilising these models, we can extract high-level features from the images by passing them through the network’s convolutional layers. These features can be used as image representations for further analysis or classification.
- Transfer Learning: Transfer learning is a technique that leverages pre-trained models on a large dataset and adapts them to a new task with a smaller dataset. We can take a pre-trained CNN model and fine-tune it on a labelled dataset specific to our ad classification problem. By fine-tuning the model’s weights on the new dataset, we can capture image representations that are optimised for our specific task.
- Image Descriptors: Image descriptors capture low-level visual features of images, such as colour, texture or shape. Examples of image descriptors include Histogram of Oriented Gradients (HOG), Scale-Invariant Feature Transform (SIFT) or Local Binary Patterns (LBP). These descriptors encode local patterns and characteristics in the image, which can be used as features for classification.
- Video: Some advertisements may contain videos in them. These can be featurised using the following techniques.
- Frame-Level Features: We could sample some individual frames from the video and featurise these using image featurisation techniques mentioned above. These frame-level features can be aggregated or processed further to obtain video-level representations.
- Optical Flow: Optical flow is a technique that captures the motion information between consecutive frames in a video. It estimates the displacement of pixels between frames, representing the movement of objects in the video. Optical flow can be computed using algorithms like Lucas-Kanade or Farneback. By analysing the optical flow, we can derive motion-based features that provide information about the dynamics of the video.
- Temporal Pooling: Temporal pooling techniques aggregate frame-level features over time to create video-level representations. Pooling methods such as average pooling or max pooling can be applied to the frame-level features, summarising the information across the video sequence. Temporal pooling helps capture global characteristics of the video and reduces the dimensionality of the feature space.
- Recurrent Neural Networks (RNNs): RNNs, such as Long Short-Term Memory (LSTM) or Gated Recurrent Unit (GRU), are capable of modelling sequential data. RNNs can be used to process the temporal sequence of frames in a video, capturing the dependencies and temporal relationships between frames. The hidden states or outputs of the RNN can serve as video-level representations.
- 3D Convolutional Neural Networks (CNNs): 3D CNNs extend traditional CNNs by considering spatial and temporal dimensions simultaneously. By incorporating 3D convolutions, these networks can directly process video data. Pre-trained models like C3D or I3D can be fine-tuned on video data, enabling them to capture spatio-temporal features effectively.
- URL
- There could be URL links in the advertisement.
- Looking at the URL itself or by following the link and scraping the website, we could find some useful features for the task.
- We could use features like `url_contains_drug_name` which is set to true if the URL name contains a drug name.
- We could use text and image featurisation techniques explained above to parse the URL webpage and generate features.
- Advertiser data
- We could use advertiser information including advertiser history.
- Features would include: `advertiser_name`, `age_on_platform`, `number_of_ads_published`, `previously_flagged_ads`, `ads_reported_by_users`, etc.
Modelling
- Logistic Regression: Logistic regression is a simple yet effective model for binary classification tasks. We could combine the features and pass it to the model. Logistic regression is interpretable and computationally efficient, but won’t capture non-linear relationships.
- Support Vector Machines (SVM): SVMs are widely used for binary classification tasks, especially when dealing with high-dimensional feature spaces. SVMs are known for their ability to handle complex decision boundaries and generalise well to new data.
- Multilayer Perceptron (MLP): MLPs are feedforward neural networks composed of multiple layers of nodes (neurons). MLPs are capable of capturing complex relationships in the data and can learn hierarchical representations.
- Ensemble Models: Ensemble models combine the predictions of multiple models to improve performance. They can be created by training different models with varied architectures or by utilising different modalities (text, image, video) and combining their predictions. Ensemble models can enhance the robustness and generalisation ability of the ad classification system.
Evaluation and Deployment
- Evaluation metrics
- Offline Metrics:
- Accuracy
- Number of correct predictions / total number of predictions.
- Straightforward to use, won’t tell much in case of imbalanced dataset as is the case here.
- AUC
- Stands for Area under the ROC Curve.
- An ROC curve (receiver operating characteristic curve) is a graph showing the performance of a classification model at all classification thresholds. This curve plots two parameters:
- True Positive Rate (TPR): is a synonym for recall and is therefore defined as: TPR = TP / (TP + FN)
- False Positive Rate (FPR) = FP / (FP + TN)
- An ROC curve plots TPR versus FPR at different classification thresholds.
- AUC provides an aggregate measure of performance across all possible classification thresholds. One way of interpreting AUC is as the probability that the model ranks a random positive example more highly than a random negative example.
- AUC is scale-invariant. It measures how well predictions are ranked, rather than their absolute values.
- AUC is classification-threshold-invariant. It measures the quality of the model’s predictions irrespective of what classification threshold is chosen.
- Precision
- Tells us what proportion of positive identifications was actually correct.
- Precision = TP / (TP + FP)
- Recall
- It tells us what proportion of actual positives was identified correctly.
- Recall = TP / (TP + FN)
- F1 score
- It is calculated as the harmonic mean of the precision and recall scores.
- F1 score = 2 * Precision * Recall / (Precision + Recall).
- Accuracy
- Online Metrics:
- User experience, Brand reputation, user trust, legal compliance, click-though rate (CTR)
- These could be directly tied back to the business objective. We could have a combination of implicit (user response, ads getting clicked, ads getting reported, etc.) and explicit (surveys, feedback, etc.) signals to track these.
- Offline Metrics:
- Setup train, test, validate partitions (to prevent overfitting)
- We could split the training data we have into training (80%), validation (10%) and test set (10%).
- If we decided to resample the training data to handle class imbalance, we should not evaluate our model on resampled data, since it will cause the model to overfit to that resampled distribution.
- A/B test setup
- We could use the existing model as control group and the new model as test group.
- In a big company, many people may be running A/B experiments with their candidate models. It’s important to make sure your results are not getting affected by other experiments. It’s good to create multiple universes consisting of external users where all experiments corresponding to a particular feature/project are run in the same universe. Inside a universe, an external user can only be assigned to one experiment, thus making sure multiple experiments from the same universe won’t influence each other’s results.
- After doing sanity check for any config errors, we route half the traffic to control group and wait for a week before analysing the results.
- We could use chi-squared test or two-sample test to see if the results are statistically significant and decide whether the new model improves on the previous model.
- Debugging offline/online metric movement inconsistencies
- It’s important to continuously monitor the ML system and have health checks in place and alerts enabled.
- We should ideally have dashboards showing the important metrics (both business and performance) and changes in these metrics over time.
- If these metrics go below a certain threshold, we should have an alerting system in place to notify the correct team.
- We should also have logging in place, which would help with debugging these issues.
- A common cause of drop in model performance is data distribution shift, when the distribution of data the model runs inference on changes compared to the distribution of data the model was trained on, leading to less accurate models.
- We could work around the problem of data distribution shift either by training the model on a massive training dataset with the intent that the model learns a comprehensive distribution, or by retraining the model (from scratch or fine-tuning) to align with the new distribution.
- Edge cases can also make the model make catastrophic mistakes and need to be kept in mind when debugging.